
html文件想要嵌入表格,但又不想要簡單的Markdown Table ? 可以考慮包含篩選,排序功能的python itables 套件
iTables is a wrapper for the Javascript DataTables library itables 以 javascript DataTable 函數為基礎,可在python執行並做進階延伸的應用,本文將介紹常用的函數與參數。
安裝與引入套件
|
|
在 VSCode 使用 itables 要安裝 JUPYTER extension
在測試 python itables 套件,發現VSCode無法在終端機顯示
首先在官網確認 itables 可以在 VSCode 環境使用,但需要安裝 Jupyter 相關套件協助
The tables are interactive in interactive books powered by Jupyter Book, see e.g. the ITables documentation. In VS Code, itables works both for Jupyter Notebooks and Python scripts.
若 VSCode 之前沒裝過,可以直接建立一份 .ipynb 的檔案並寫幾行code測試,按下執行(run)按鈕,系統會詢問你是否要自動安裝 jupyter extensions。
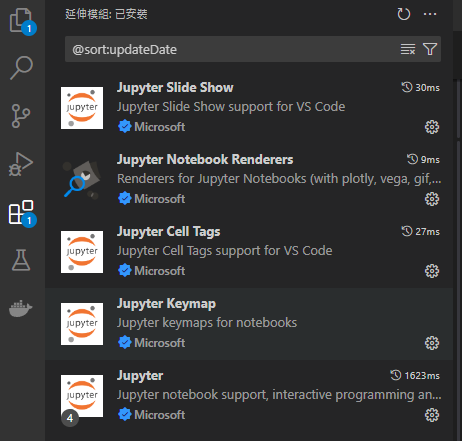
完成後可點選左側延伸模組檢查相關套件的安裝情況:
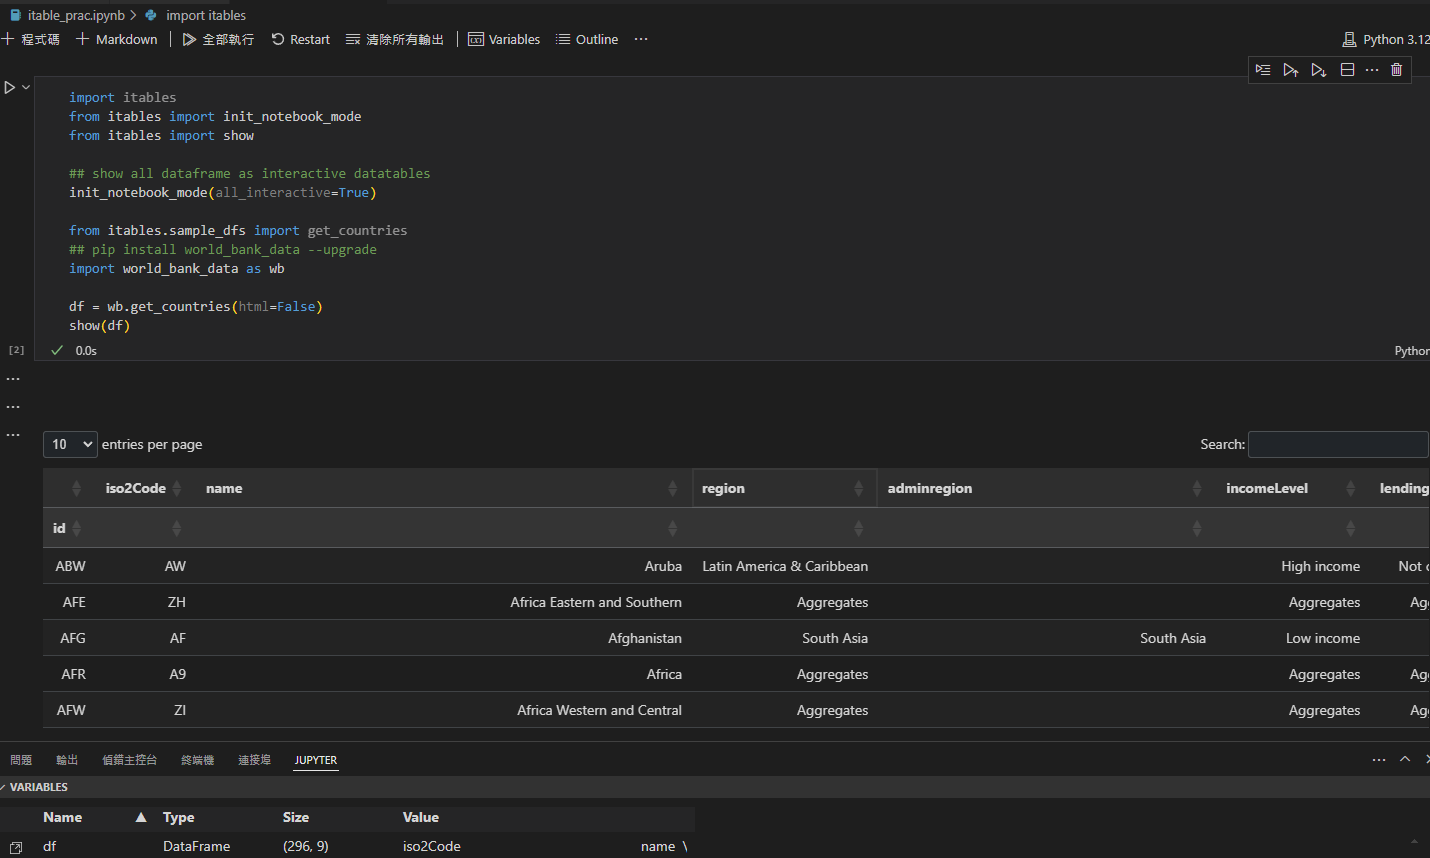
在終端機block 也多出一個 Jupyter 的選項

現在可以block執行
最終成功跑出想要的可以排序篩選的互動式表格:
啟動互動式 notebook 環境
|
|
可以使用範例表格作為輸入,檢查是否有為互動模式
|
|
另外一個範例
|
|
添加渲染與參數
使用 show() 協助渲染表格呈現的內容,大部分參數介紹都可參考 DataTable 的手冊
|
|
常用的參數包含:
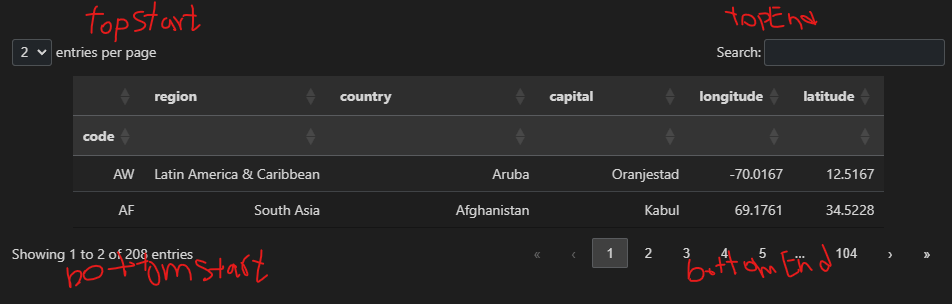
lengthMenu = [2,10,25]以列表調整左上角的 entries per page 每頁顯示的資料筆數caption = "string"標題預設位置在表格底部caption-side:bottom,可透過style='caption-side:top'調整至表格上方layout={}調整表格四個角落的內容,預設顯示:
|
|
 - `search={}` 調整搜尋匹配內容 `"regex": True, "caseInsensitive": True, search: "default search str"`
- `paging=False` 會顯示表格全部的內容,會讓 `lengthMenu` 設定失效;若想要限制畫面呈現數量,可搭配 `scrollCollapse=True, scrollY="200px"` 設定卷軸滾動
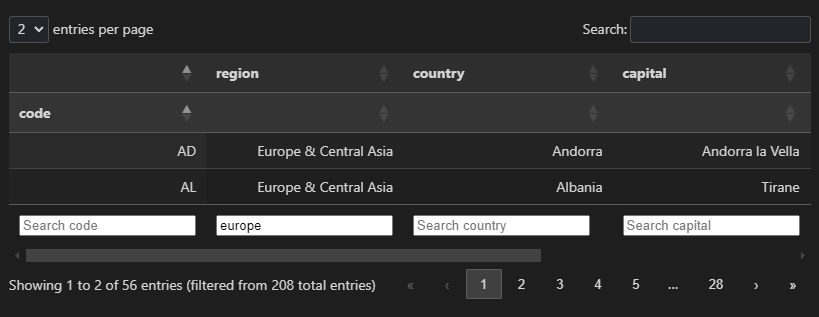
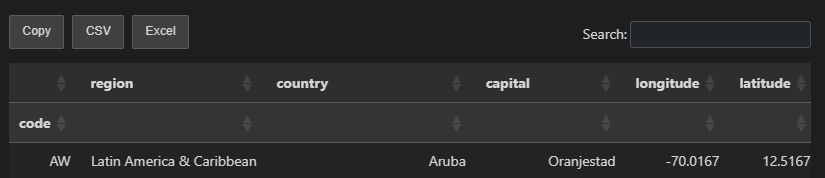
- `column_filters = "footer"` 允許針對個別欄位篩選,且將 search bar 顯示在表格下方
- `search={}` 調整搜尋匹配內容 `"regex": True, "caseInsensitive": True, search: "default search str"`
- `paging=False` 會顯示表格全部的內容,會讓 `lengthMenu` 設定失效;若想要限制畫面呈現數量,可搭配 `scrollCollapse=True, scrollY="200px"` 設定卷軸滾動
- `column_filters = "footer"` 允許針對個別欄位篩選,且將 search bar 顯示在表格下方
表格外觀參數
classes="compact"設定表格擁擠,classes="cell-border"添加格線style=添加CSS相關樣式
使用pandas Styler object:
|
|
s.background_gradient(axis=None, cmap="YlOrRd") 依數字大小給予不同顏色梯度(colormap)
s.format("{:.3}") 調整位數(.3代表顯示三個數字剩下四捨五入)
輸出表格
|
|
表格會出現以下三個按鈕,分別代表複製表格內容、下載為CSV檔和下載為XLSX檔
可使用 pandas
嵌入外部網頁
目前支援嵌入 HTML 和 Shiny
References
https://code.visualstudio.com/docs/datascience/jupyter-notebooks https://datatables.net/ https://hackmd.io/@DokiDokiPB/Hy05n_Mzs